NYC Taxi at ScaleBig Data
Cleaning, analysing and modelling 964 million taxi trips, end to end on Databricks.
Eleven years of New York taxi trips, 964 million rows after cleaning, processed with Spark on Databricks. The analysis answers operator questions (where the money is, when tips happen, which trips pay a driver best), and a fare model closes the loop, cutting prediction error by 28 percent against the baseline.
A billion-row table, cleaned by rules
Yellow and green cab records from 2014 to 2024 arrive with impossible trips: pickups after dropoffs, 120 kilometre-per-hour averages, one-minute false starts, fares below New York's 3.30 dollar base fare and above 1,000. Nine explicit rules remove them, each reporting how many rows it dropped, under a brief that capped total data loss at 10 percent. The two fleets speak different schemas (tpep against lpep timestamps, fees that exist on one fleet only), so they are unified into one, tagged by colour, enriched with borough names by broadcasting the tiny zone table against the billion-row one, and stored as a 964,078,678 row Delta table so downstream steps never recompute from raw.

What a billion trips say
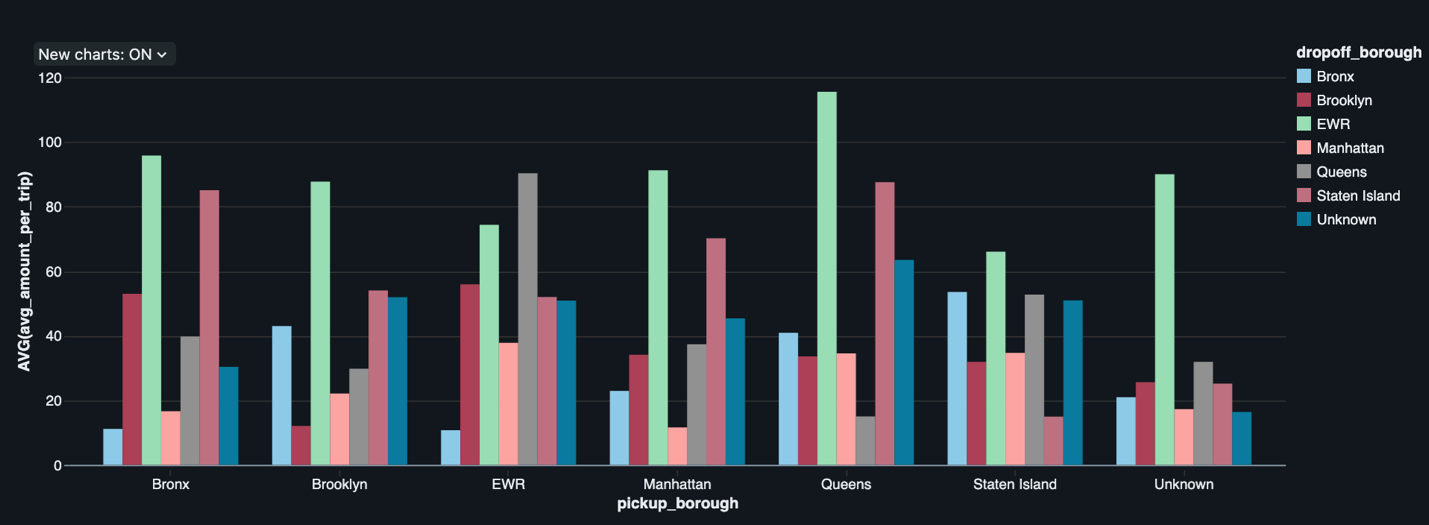
Spark SQL over the full table answers the operator questions. Trips inside Manhattan carry 61.9 percent of 2024 revenue (696 million dollars), with Queens-to-Manhattan a distant second at 15.5. Tipping has a shape: 63.07 percent of trips tip at all, but only 0.83 percent of tippers give 15 dollars or more, roughly one generous tip in 190 trips. For a driver the trade is explicit: half-hour-plus trips pay the best hourly rate (66.48 dollars) but arrive rarely, while under-five-minute hops pay the best rate per kilometre (6.42 dollars) at a solid 58.10 per hour, and the write-up argues that is the sustainable optimum. The heaviest of these queries crosses roughly a billion rows in about a minute.

The patterns underneath
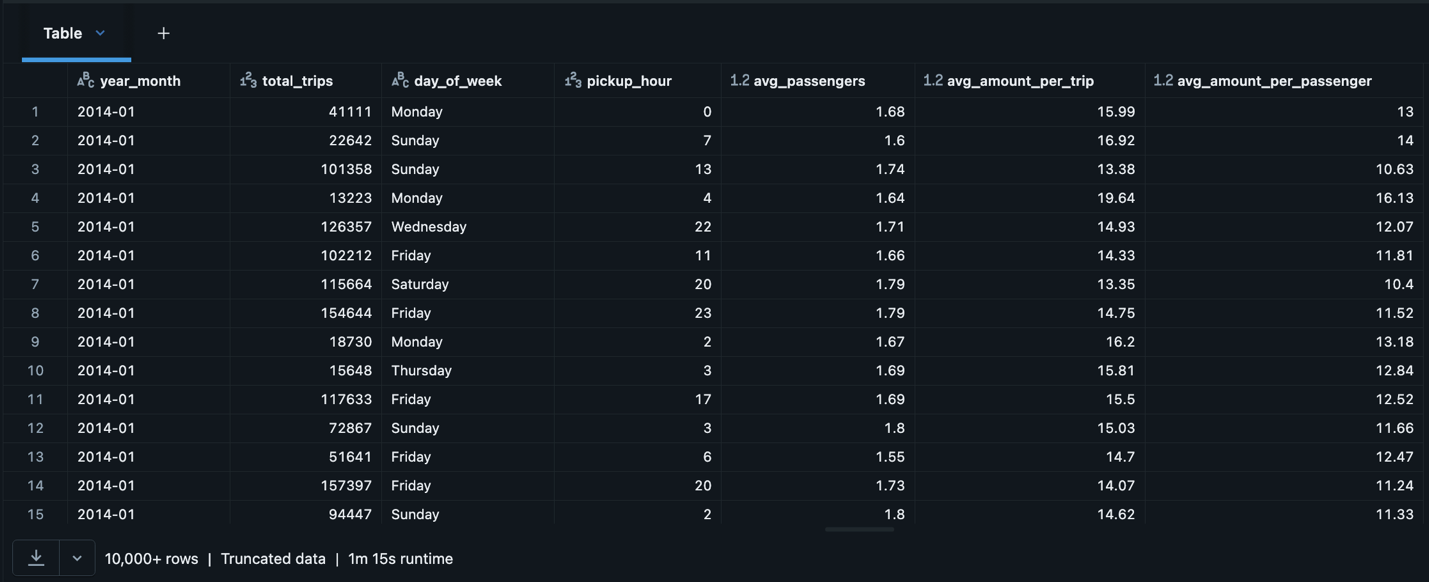
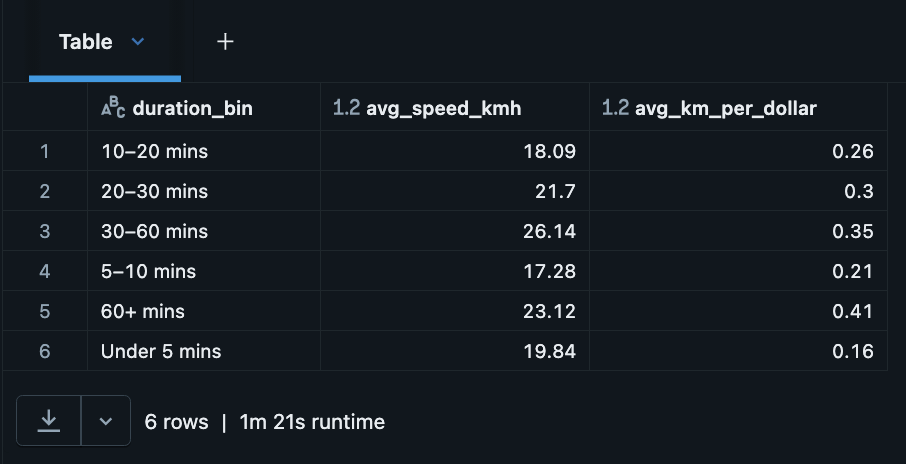
The rhythm of the city is in the aggregates: volumes peak in July and December and on Fridays, evenings from five to eight are the busiest hours, and the average trip carries just 1.2 to 1.4 passengers. The efficiency cut explains driver economics from the cost side: trips under ten minutes are the least cost-efficient for the passenger (0.16 km per dollar) because fixed fares and surcharges dominate short rides. Even the trips-per-hour estimate is honest about the real world: it assumes a four-minute turnaround between fares rather than pretending drivers teleport to the next pickup.
A fare model on top
The prediction target is the total fare, split by time so the model is judged on genuinely future trips: everything to September 2024 trains, October onward tests. The baseline is computed honestly at full scale, a group-average fare over all 953 million training rows in Spark, landing at RMSE 17.10. The learned models trained on a 1 percent sample, a documented constraint (full-data training exceeded the cluster's memory), and still cut the error: 13.28 for a linear model, 12.26 for tuned gradient boosting. The write-up translates that plainly: an average miss near 10 dollars is fine for daily or borough-level planning where errors cancel, and not good enough to quote a single trip's fare.
# Group keys = color x PU x DO x month x day of the week x time
KEYS = ["color","pickup_borough","dropoff_borough","month","dow","hour"]

train_mean = (
    train_df.groupBy(KEYS)
    .agg(F.avg("total_amount").alias("avg_total_amount"))
)

# Left join to test to get mean value as predicted value
pred_baseline = (
    test_df.join(train_mean, on=KEYS, how="left")
           .withColumn("pred", F.coalesce(F.col("avg_total_amount"), F.lit(None)))
)