Student Performance PredictionMachine Learning
Finding the top 5 percent of students early, so a university can recommend them for internships.
Only 56 students in roughly 1,000 reach the top grade, and the university wants to spot them before final results are out. After forensic data cleaning and honest feature work, the tuned random forest found 10 of the 11 top students in the test set, with a single false alarm.
A needle-in-a-haystack target
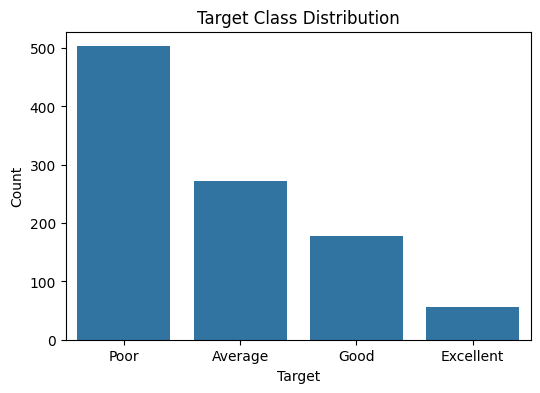
The scenario: recommend the students most likely to finish with an Excellent result to industry partners for internships, before final grades exist. In 1,009 student records only 5.55 percent are Excellent, so plain accuracy is meaningless: a model that says no to everyone is 94 percent accurate and completely useless. That framing drove every design choice. The cost of a miss is asymmetric (a false negative is a deserving student losing an opportunity, a false positive risks the programme's credibility with partners), so recall was prioritised, F1 became the tuning objective, and a two-stage stratified split kept the tiny minority class at the same 5.5 percent in train, validation and test.
Cleaning with logic, not just thresholds
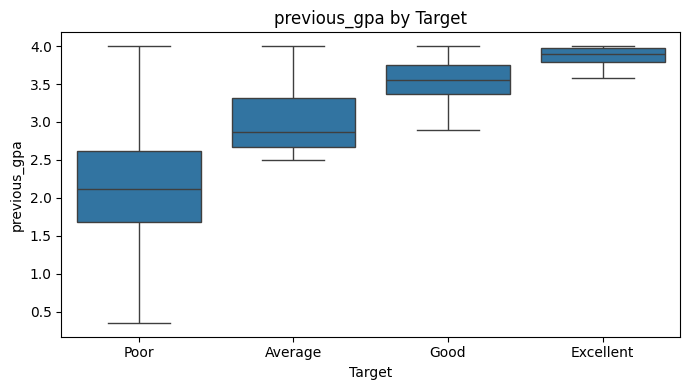
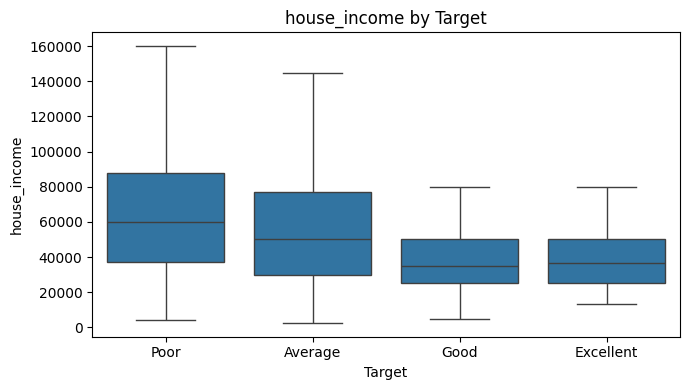
The data forensics mattered as much as the modelling, and the interesting rows fail by logic, not by magnitude: first-semester students carrying a previous GPA (impossible, so out), an admission year of 22022 (a typo, fixed), a student studying 30 hours a day (removed). Extreme household incomes were capped at the 95th percentile rather than deleted, because rich students are real even when their values distort a model. One finding was counterintuitive enough to test properly: in this data, higher-performing students come from lower-income households. Rather than trust the eyeball, a Welch t-test (p = 0.0000010756) settled it, and the feature stayed. A gpa_change feature (current minus previous GPA) was added to capture academic momentum, not just level.
The model tournament
Every model faced the same question: how many of the rare top students do you find, and at what cost? The baseline logistic regression looked respectable on paper but missed most of them (validation recall 0.36). A tuned random forest (randomised search over 30 configurations, scored on F1) lifted validation recall to 0.73 and reached 0.91 precision and 0.91 recall on test: 10 of the 11 Excellent students found, one false alarm. A tuned SVC matched it on test but was weaker where it counts, validation recall. KNN was the interesting loser: perfect precision (every student it flagged was truly Excellent) but recall 0.82, and a recommender that misses deserving students fails the brief. The forest won on the balance.
An honest ablation, honest limits
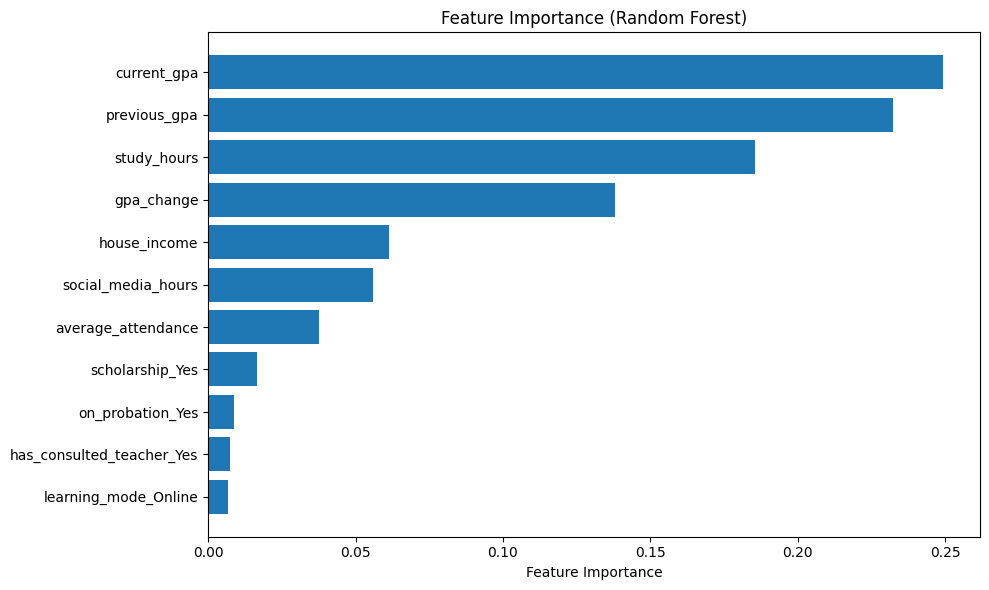
The importance plot said the categorical features were nearly useless, so a final experiment removed them, holding everything else fixed, and performance dropped. The randomised search even landed on identical best parameters, which is what makes the conclusion clean: the drop came from the features, not from tuning luck. Hypothesis rejected, and recorded as rejected. The write-up is equally plain about limits: the test set holds only 11 Excellent students, so test metrics move in nine-point steps, and the model is framed as input to a human decision, with an eligibility rule on completed credits applied downstream rather than trusted as a model feature.
X = df_eng.copy()
y = df.loc[X.index, 'target']

# Step 1: Train+Val vs Test (80:20)
sss1 = StratifiedShuffleSplit(n_splits=1, test_size=0.2, random_state=42)
for trainval_idx, test_idx in sss1.split(X, y):
    X_trainval, X_test = X.iloc[trainval_idx], X.iloc[test_idx]
    y_trainval, y_test = y.iloc[trainval_idx], y.iloc[test_idx]

# Step 2: Train vs Val (75:25)
sss2 = StratifiedShuffleSplit(n_splits=1, test_size=0.25, random_state=42)
for train_idx, val_idx in sss2.split(X_trainval, y_trainval):
    X_train, X_val = X_trainval.iloc[train_idx], X_trainval.iloc[val_idx]
    y_train_raw = y_trainval.iloc[train_idx]
    y_val_raw   = y_trainval.iloc[val_idx]